 I just recently when through a round of code upgrade (at least 3 firmware versions each) on 300+ Procurve switches and so I thought I’d share with you what I had gone through.
My buddy Dean & I were tasked to upgrade a number of switches. What we did was breaking them down into three phases spanning 3 days for a total of 16 hours window. Although we had HP Network Automation (HPNA) available at our disposal, but I chose to do this manually due to a number of factors including code version inconsistency, boot room, primary vs secondary software image… Plus I also wanted to see how far we can push Pinkie so it was a perfect scenario doing the upgrade manually.
First, let’s talk about how we can push the images to the switches then we’ll go through the issues encountered during the upgrade and how to tackle them. So, there are a number of ways you can get a firmware onto a HP Procurve switch. Let’s walk through them real quick:
1. X-modem: Slow, unsuitable for production environment upgrade. Handy to recover corrupted flash.
2. USB Drive: Fast, efficient way to transfer, only available on certain code version. Not suiteable large scale upgrade.
3. TFTP: Fast, efficient, requires IP connectivity. Suiteable for production code upgrade.
Of the available options, only TFTP file transfer was suitable to do what we wanted to accomplished. There were a number of TFTP servers available but being that I wrote Pinkie, I wouldn’t want to use any other TFTP server but Pinkie itself.
So how did we manage to upgrade 3 or more code versions on 300+ switches in under 16 hours change window? Preparation. Preparation was the key. Prior to the actual change window, we staged both primary and secondary firmware with the next code versions. If you are not familiar with Procurve firmware, they have to be upgraded sequentially since the firmware ties in with the boot-rom (I’ll explain in another blog post). When the change window came, we used our terminal client and SSH’ed into the switches, rebooted them while having Pinkie constantly pinging them. As soon as they came backup, we logged in again booted to the other image using the boot-system flash [primary/secondary] command. After they came up the second time around, we pushed the third and final firmware (for most of them) to the switches using copy tftp flash command and rebooted again. All the commands were prepared in little code snippets and pasted into the terminal client so it went rather smoothly.
At some point during the operation we had pushed Pinkie so hard (there were some 30-40 simultaneous TFTP requests going at the same time) that it locked up the user interface. We thought for sure that it’s gonna crash but Pinkie hung in there and finished all TFTP file transfers even though the screen didn’t get updated for quite some time.
During the process, we ran into a number of issues. One Procurve 3500 yl switch had corrupted flash. We didn’t have time to repair the corrupted flash on the 3500 on the spot so we replaced the whole switch and opted to repair it later when we have some time on hand. And it was successfully repaired using x-modem file transfer the next day.
There were a handful of 5406 yl switches that had corrupted flash also. But for those, we were able to pull out the management cards and swapped out the flash memory then put them back to service. The thing is you’ve gotta have a spare management module with the flash card that has firmware compatible with the boot rom on the bad management module.
Below are some commands that we used during the code upgrade process:
boot – reboot the switch to the current image.
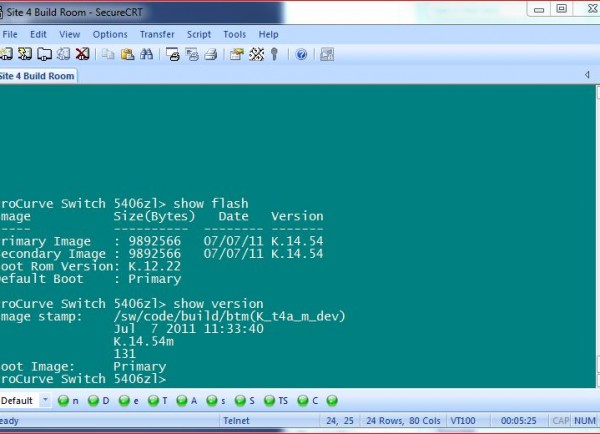
show flash – show the firmware version on both primary and secondary boot images.
show version – show the running firmware and next boot image.
copy tftp flash… – initiates a file transfer request and copy the firmware from tftp server to the switch.
copy flash flash [primary/secondary] – copy the firmware from one slot to another.
That’s pretty much how we did it but like I said in the beginning, we broke it down into 3 phases. The first phase we did it on a single POD of about 40 switches to get a feel for it then we double it on the second phase and finally on the third one, we did the rest of them.
One important thing I should note is that you need to look out for distribution switches – either do them first or do them last. I overlooked one of them and as the result, I had to wait for it to finish before I could touch the aggregation & edge switches. And it just happened that one of the distribution switches had corrupted flash so that delayed our code upgrade process longer than expected; although we did finish it under our reserved window for the change.
There you have it. That’s how I did my firmware upgrade and the issue that I ran into during the process. If you have any tips & tricks on how it could be done better, by all means, let me know.


Recent Comments